How To Visualize Climate Change - Idea #4,379: DebateGraph
I'll admit it: I'm addicted. My fix: discovering new ways to tell stories through innovative uses of visuals.
Most of the 350.org team shares this obsession. We've realized: in a world shaped by YouTube and cell-phone cameras, static words on a page carry increasingly less weight. So we often focus on the visualization.
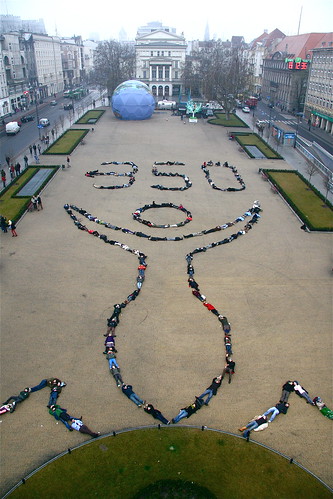
Some of our favorite examples are remarkably simple, like using photos to channel a political message (like we do with 350 or our last national campaign, Step It Up). Others are a bit more advanced—like our 90-second, wordless animation or the elegant use of infographics to explain complex topics.
Lately, I've been excited about non-linear presentations of information that allow users to explore topics at their own pace—and in their own way. This is sort of a “choose your own adventure” method of presenting information.
One tool I stumbled across today is DebateGraph, an amazing resource its developers describe as “a wiki debate visualization tool.” Their goal is noble: “to make the best arguments on all sides of any public debate freely available to all and continuously open to challenge and improvement by all.”
They're are “DebateGraphs” on all sorts of topics—from Peace in the Middle East to the Financial Crisis. You sort of have to see it to understand. To that end, I've embedded the Climate Change Debate Graph below.
From a scientific perspective, “the debate is over” about the existence of human-caused climate change. That said, some of the more nuanced aspects of how to deal with it deserve a robust, public debate. DebateGraph makes that debate easier—and more interesting. Check it out:
The Science of 350
Scientists say that 350 parts per million CO2 in the atmosphere is the safe limit for humanity. Learn more about 350 – what it means, where it came from, and how to get there. Read More »
Featured Updates
Not Done Yet.
You've always counted on us to tell the truth, and it would be useless to pretend we're happy with the outcome of the Copenhagen climate talks.... Read Post »
Two Unusual Requests
Apologies again for bombarding you with updates, but we're in the final stretch here at Copenhagen and I hope you can join us in doing two unusual things. They're unusual things for us to ask, but this is an unusual moment.... Read Post »
Copenhagen: Inside and Outside
Since we're all working on the same team, we wanted to give you an inside/outside sense of all that's happening in one of the more important weeks in the history of this ball of rock and water we call the earth...Read Post »
To submit your photos and action reports to 350.org, please click here.
Understanding 350
- So, what is global warming and what's the problem anyway?
- And what does this 350 number even mean?
- If we're already past 350, are we all doomed?
- How do we create the political change to steer towards 350?
- How do we get the world on track to get to 350?
- How do we actually reduce carbon emissions to get to 350??
- Will this thing work? Will world leaders listen?
- Where did this 350 number come from?
- Isn't America the biggest source of the problem? What about China and India?
- 350 is just a number. Wouldn't "Climate Emergency" or "Clean Energy Now" be a better call to action?
- And what about all the other targets people are aiming for?
- Why October 24th?
- Why another organization--there are already too many things going on!
- Do you measure 350 in CO2 or CO2e?
More...
Donate to350
Support an international movement to solve the climate crisis. Whether 3.50, 35.00, or 350.00, euros, dollars, or pesos, your contribution helps us keep going.
***To make a donation, please visit http://www.350.org/donate***
350 Store
Help spread the word and look good while doing it--check out the 350 Store for t-shirts, buttons, stickers, and more.
350 Music
Raise the volume, lower your emissions: Launch the 350 music player! »
Problems launching the player? Try here.


Post new comment